
A tour of HomeRoom: where the store becomes the Living Classroom
A grounded tour of the dashboard, analytics, teaching tools, catalog, and reports that are live in HomeRoom today.
 The RallyOrder Team · Aug 6, 2026 · 6 min read
 The Friday Huddle gives a store a weekly operating rhythm. HomeRoom supplies the numbers and the tools behind it.
HomeRoom is where advisors and student teams manage the catalog, review the business, and turn store activity into a classroom discussion.
We call that connection the Living Classroom: students operate the store, read what happened, and make the next decision from real results.
The dashboard: the first read
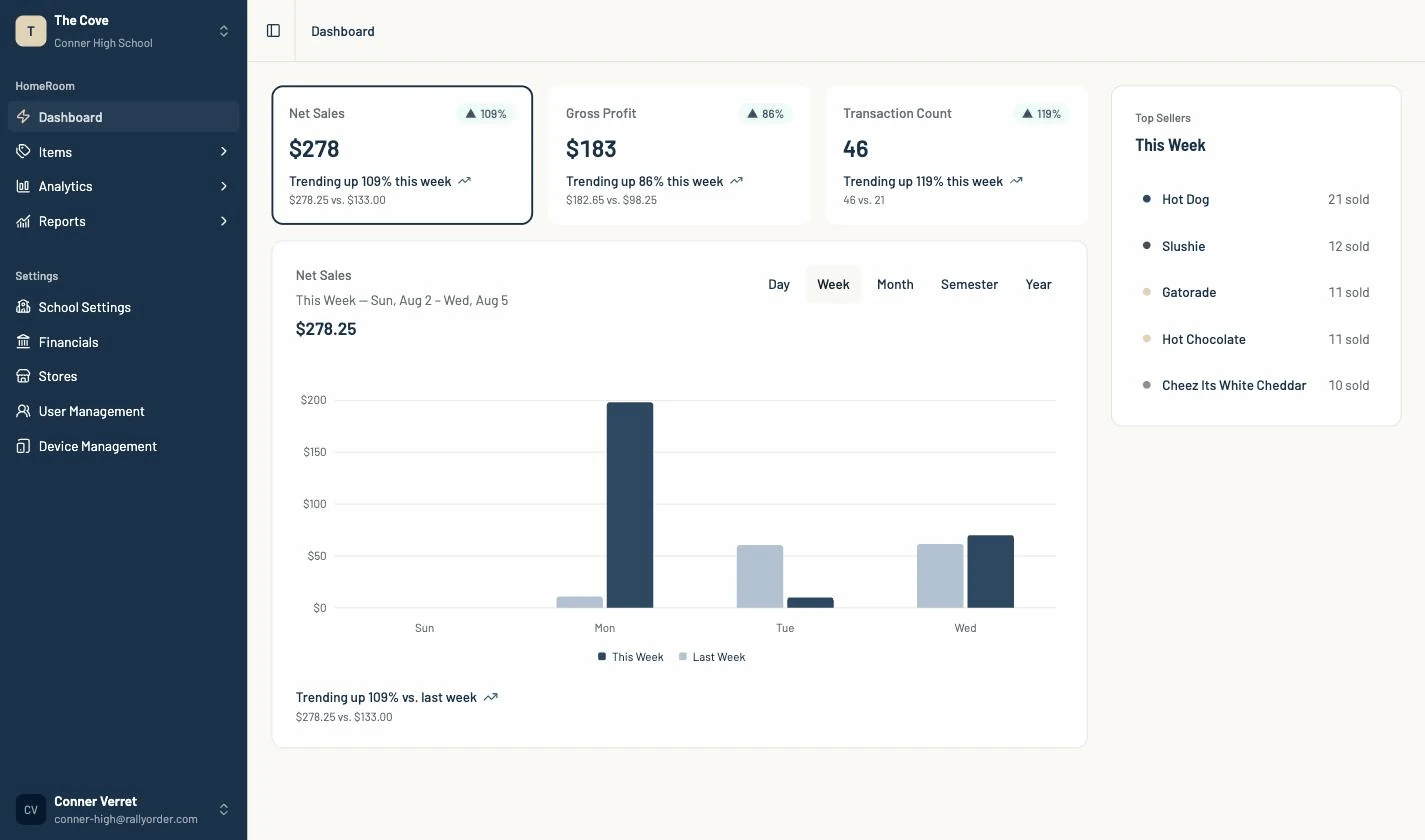
The dashboard starts with three measures: net sales, gross profit, and transaction count.
The trend chart puts the current period beside the prior one. A daily view compares the same weekday with the previous week, so a Tuesday is measured against another Tuesday.
Day, Week, Month, Semester, Year
The period selector changes the same view across five time frames.
Day supports a lunch-rush review. Week supports the Friday Huddle. Semester and Year give a class enough distance to see product launches, seasonal swings, and longer operating patterns.
HomeRoom offers Day, Week, Month, Semester, and Year reporting periods and applies the school’s timezone.
Analytics: follow the question
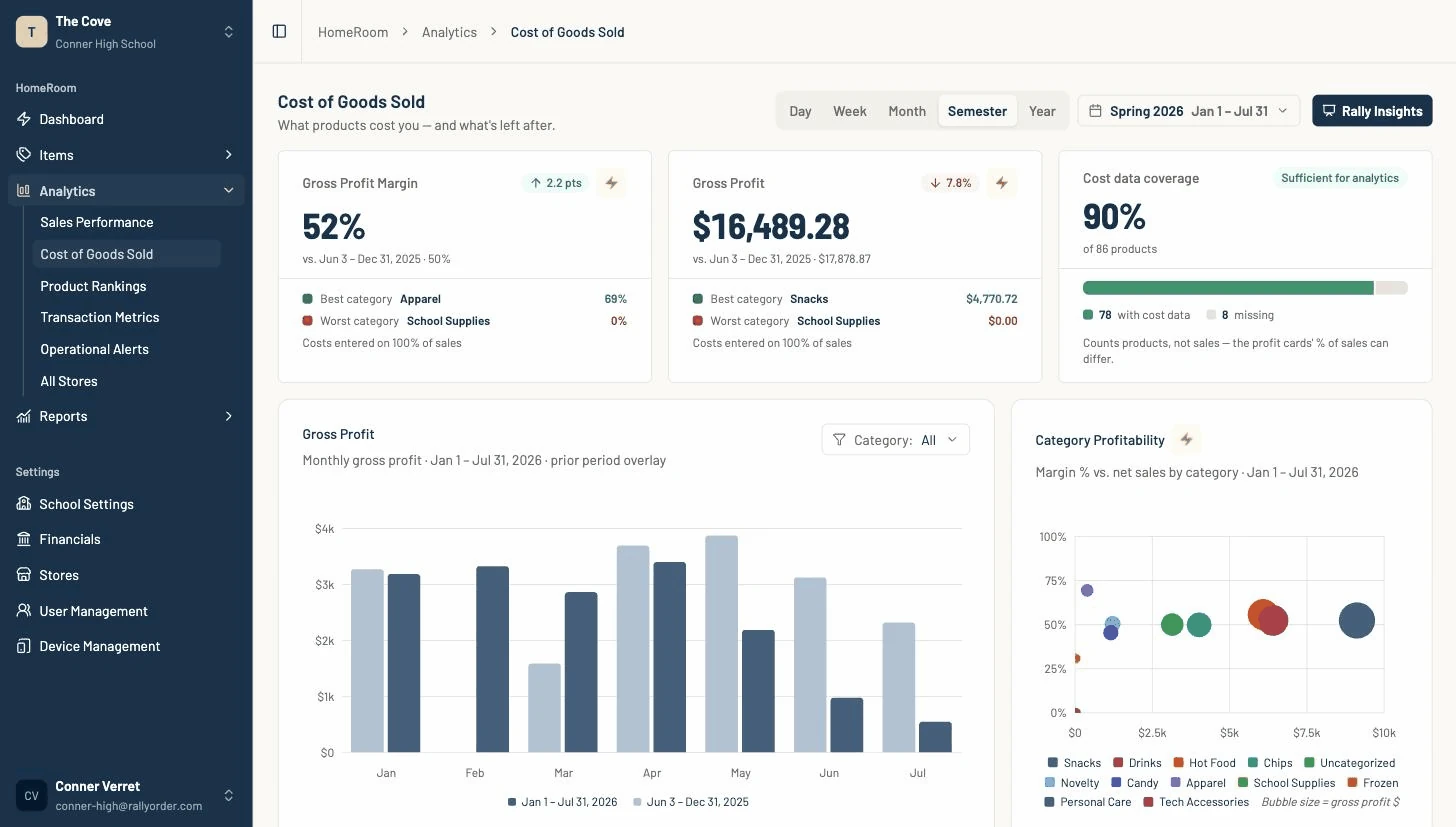
Sales Performance breaks results into time periods and categories. Cost of Goods Sold shows margin and reports how much of the catalog has cost data behind the calculation.
Transaction Metrics covers checkout speed, payment mix, basket composition, and sales by hour. Operational Alerts surfaces margin and stock conditions that may need attention.
These reports read live transaction data. Once a sale syncs from the register, it is available to the reporting layer without waiting for a nightly batch.
Product Rankings: what is moving
Product Rankings can order the catalog by units, sales, or profit. It also shows product mix and slow movers.
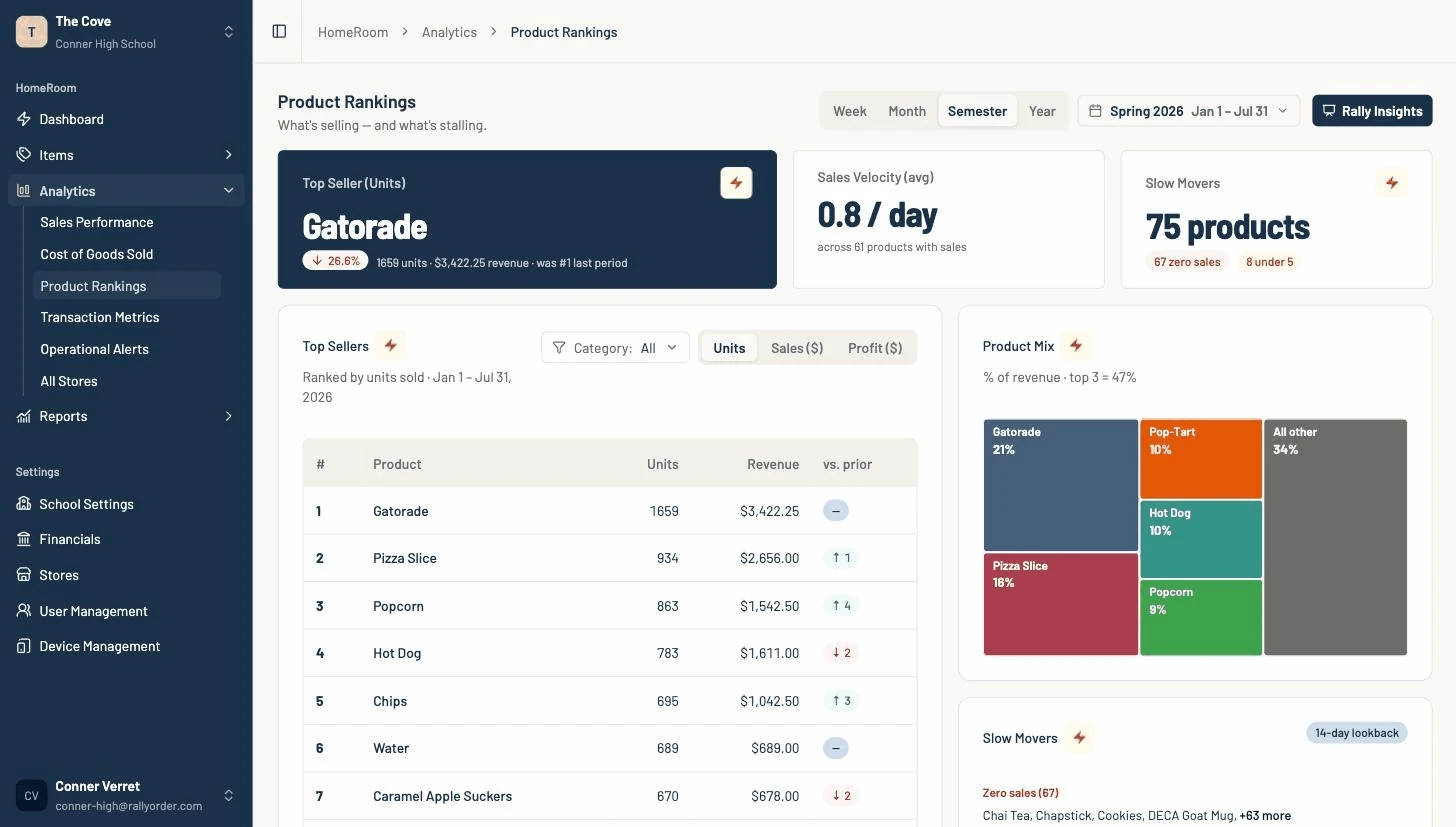
Read that view beside stock counts to answer two practical questions: what should the team reorder, and what should it stop buying?
Bolt Explains: the lesson on the metric
Metric cards carry a lightning-bolt control. Open it to see what the measure means, why it matters, and a worked example in store terms.
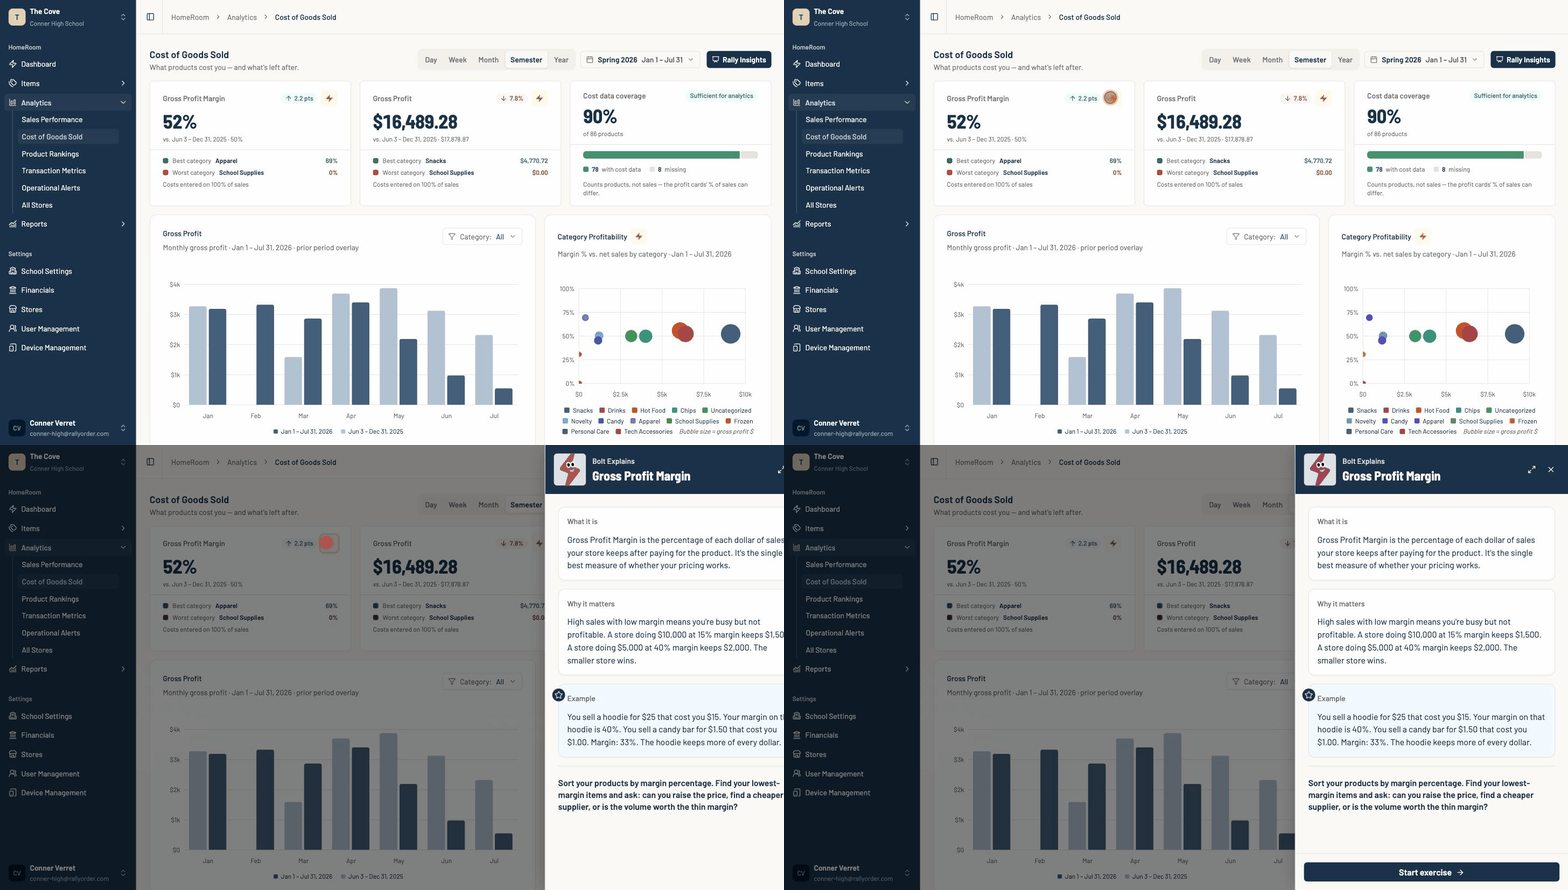
Some metrics also include an exercise. The explanation sits beside the store’s own result, so a student can connect the definition with the number under discussion.
Rally Insights: a ready-made discussion
Rally Insights turns the selected period into a short presentation with the headline, key numbers, top seller, changes, and points to watch.
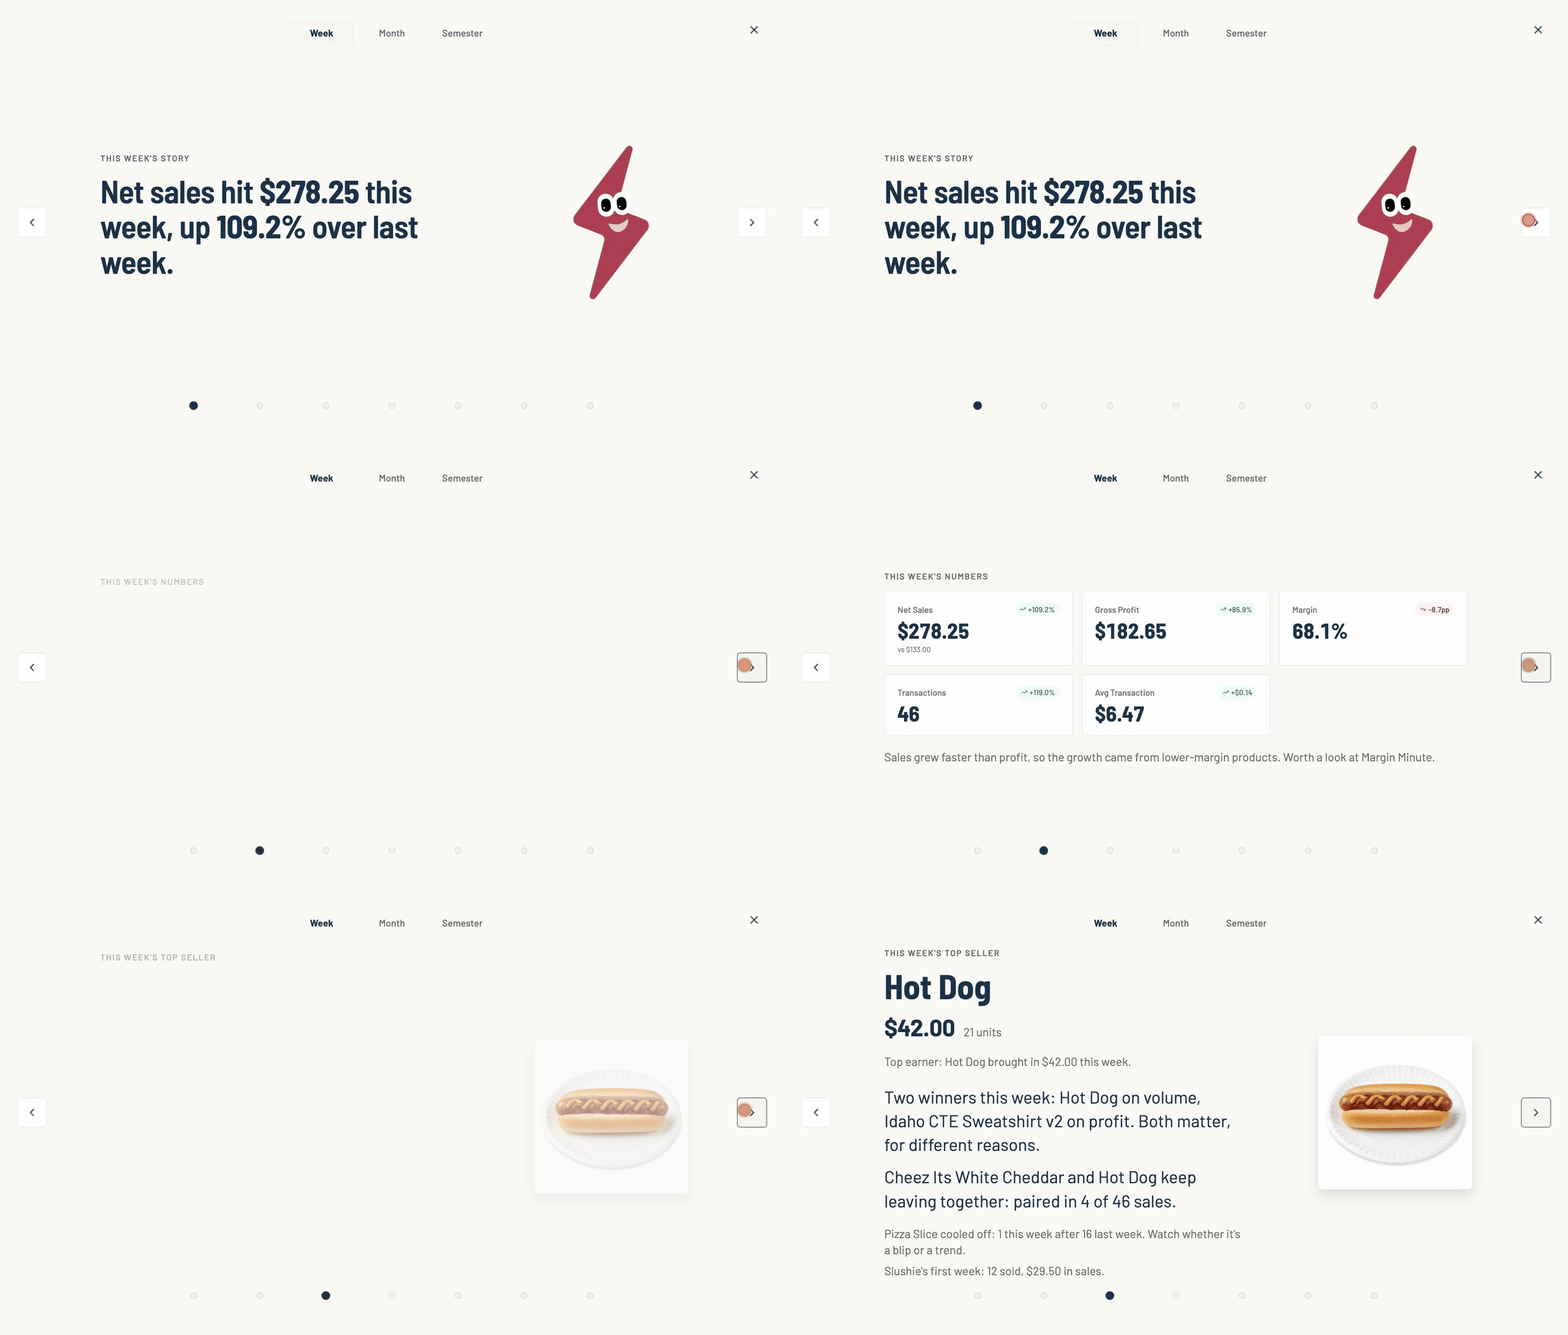
Put it on a classroom screen and use it as the starting point for the weekly review. The figures match the analytics pages the team can inspect in more detail.
Items: the catalog behind the registers
Item Management is where the team edits products, variants, prices, costs, images, availability, and stock counts. Products can be organized under the categories already available to the store.
Every paired register syncs from that catalog. A price or product change can reach the selling floor without editing each register separately.
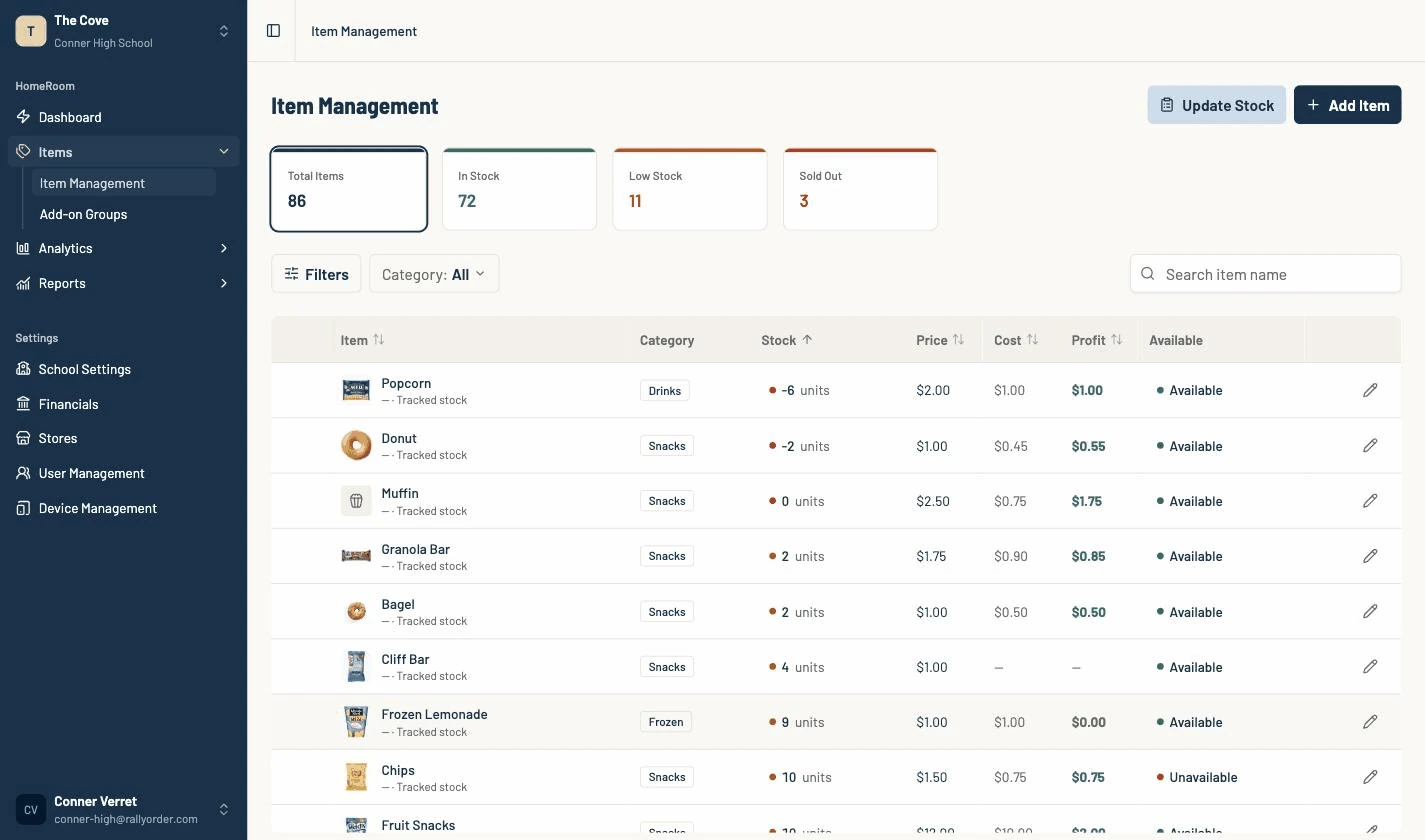
Inventory is advisory at checkout. A count can go below zero rather than blocking a sale, and the team reconciles the difference after the rush.
Reports: the control layer
Cash Drawer is live and advisor-only. It records each drawer session with expected cash, counted cash, and variance.
Failed Offline Payments is also live. It gives the school a follow-up record when an offline card payment later declines.
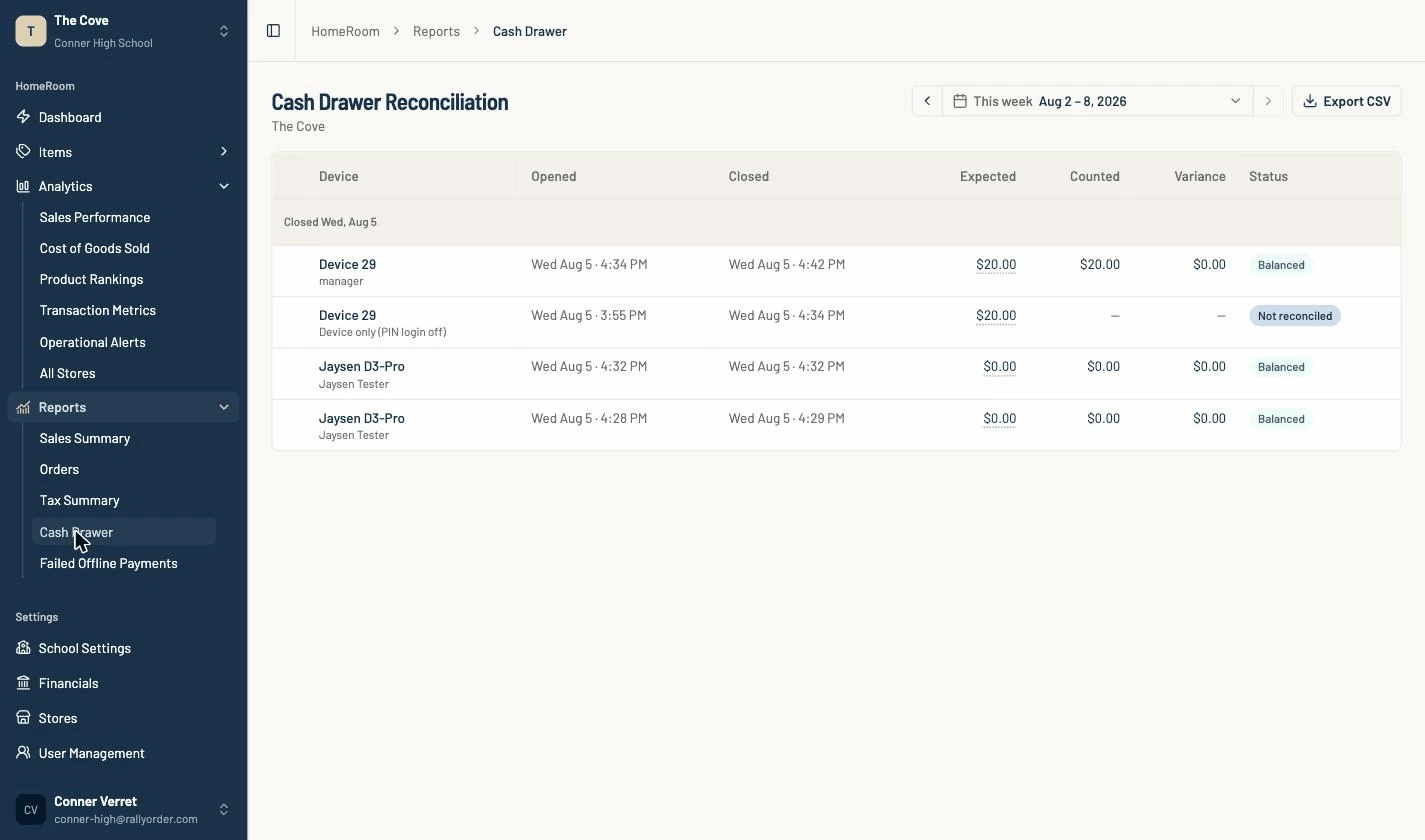
Sales, tax, and refund data can be exported to CSV. Their complete on-screen report pages are still being added to HomeRoom, so this tour does not present those pages as finished.
HomeRoom connects the operating work with the teaching work. The same system students use to run the store gives them the evidence to explain what happened and decide what to do next.
Book a live HomeRoom tour and bring the questions your students or finance team would ask.